
The opening of a Starbucks near South Korea’s Demilitarized Zone (DMZ) highlights the intersection of global commerce and geopolitics, showcasing the brand’s ability to establish itself even in politically sensitive locations. Positioned in an observatory in Gimpo, just 1.4 km from North Korea, the café provides patrons with a rare view of the reclusive state while enjoying the familiarity of a latte. This unique location is expected to attract both domestic and international visitors, capitalizing on the DMZ’s status as an unlikely tourist destination.
While Starbucks often tailors its expansion strategies to local cultural and economic contexts, this store’s strategic placement reflects its ambition to tap into South Korea’s thriving coffee culture while offering a distinctive experience. Tourists passing through military checkpoints and viewing North Korean territory emphasize the symbolic and literal bridging of starkly different worlds—a marketing narrative that could further boost Starbucks’ appeal.
From a business perspective, this venture demonstrates Starbucks’ commitment to innovation in location strategy, leveraging geopolitical intrigue to drive foot traffic. However, given the ongoing tensions on the Korean peninsula, the store’s proximity to such a contentious border could pose operational and reputational risks. Overall, this opening underscores the brand’s global reach and ability to find opportunity in unconventional markets.
Sturbucks Stock Chart Analysis
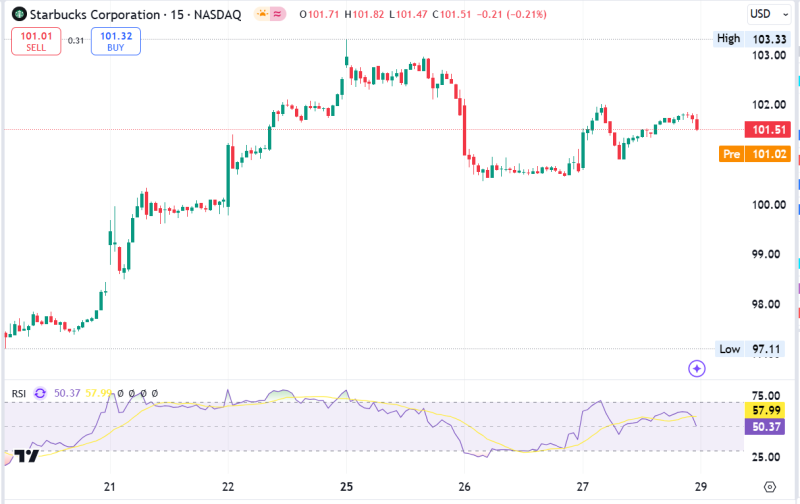
This 15-minute chart for Starbucks Corporation (SBUX) highlights recent price action. The stock is trading at $101.51, down 0.21% for the day. The overall trend on this timeframe shows a sharp rally early in the week, followed by a pullback and consolidation.

The chart indicates a recent high of $103.33, which may act as a key resistance level. The price retreated from this level and found support near $97.11. This bounce shows potential buyer interest around the lower levels. The recovery on the 27th suggests renewed bullish momentum but is tempered by some sideways trading in the most recent sessions.
The Relative Strength Index (RSI) is at 50.37, which reflects neutral momentum. It suggests neither overbought nor oversold conditions, indicating potential indecision among market participants.
From a technical perspective, the key zones to watch include resistance at $103.33 and support at $97.11. A break above resistance could pave the way for further upside, while a drop below support might indicate renewed bearish sentiment.
Traders may look for confirmation through volume or additional indicators, as the sideways consolidation suggests a lack of strong conviction in either direction at the moment. A breakout or breakdown is likely to set the next trend.
The post Starbucks (SBUX) Stock Analysis: Key Resistance at $103.33 appeared first on FinanceBrokerage.


