
Alibaba Group Holding Ltd. reported mixed results for its September quarter, highlighting both opportunities and challenges within China’s e-commerce sector. Net income surged 58% year-over-year to 43.9 billion yuan ($6.07 billion), significantly outperforming the LSEG consensus of 25.83 billion yuan. The robust profit growth stemmed from gains in equity investments, lower impairment losses, and stronger operational income.
Revenue, however, grew by a modest 5% to 236.5 billion yuan, falling short of analyst expectations of 238.9 billion yuan. Alibaba’s core commerce units, Taobao and Tmall Group, posted a slight 1% increase in revenue to 98.99 billion yuan, reflecting the broader impact of subdued consumer spending in China.
Despite macroeconomic headwinds, Alibaba’s New York-listed shares have climbed nearly 17% year-to-date, buoyed by optimism surrounding its strategic initiatives and market position. The stock rose an additional 5% in premarket trading following the earnings release.
Alibaba’s results come amid a challenging landscape for Chinese retailers, as sluggish economic recovery weighs on consumer sentiment. However, recent data points to cautious optimism. October’s retail sales rose 4.8% year-over-year, exceeding forecasts, and China’s Singles’ Day shopping festival showed signs of renewed vigor.
Beijing’s recent stimulus measures, including a 1.4-trillion-yuan package, could provide a much-needed boost to consumer spending and economic stability, offering potential tailwinds for Alibaba in the quarters ahead. Investors will closely monitor how these policies influence the retail sector and Alibaba’s performance moving forward.
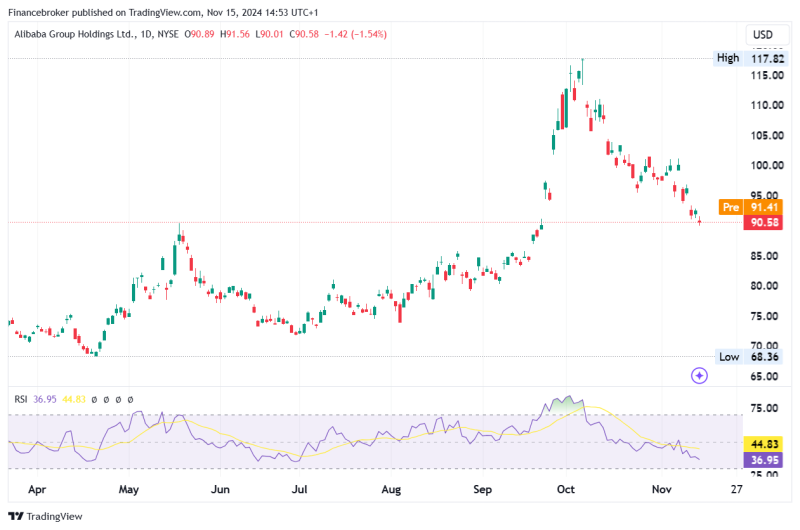
Alibaba Stock Chart Analysis
The 15-minute chart for Alibaba Group Holdings Ltd. (NYSE: BABA) stock shows recent volatility and a decline in momentum. After a sharp drop from the 95.66 level on November 7, the stock attempted to stabilize but encountered resistance around the 92 level, which has capped upside attempts. The price continued to exhibit a gradual downward trend, closing at approximately 91.61, down 0.21%.

Recent trading sessions indicate a lack of buying strength, as reflected in the failure to break through resistance levels. The chart shows multiple red candlesticks, highlighting bearish sentiment, and support is now seen near the 90 level. Should the stock breach this support, further downside pressure could be anticipated.
The pre-market price of 91.52 suggests a minor increase, but with limited momentum, especially if the broader Chinese economic concerns weigh on sentiment. The Relative Strength Index (RSI) remains low, signaling that the stock is not yet oversold but is leaning towards bearish momentum.
In the near term, traders may watch for a potential bounce near the 90.54 support or a break below it as a signal for continued bearish movement. A sustained move above 92 could offer a reversal opportunity, but overall sentiment remains cautious amid macroeconomic challenges in China.
The post Alibaba Stock Rises 5% in Premarket appeared first on FinanceBrokerage.


