
As we near the end of October 2024, it’s important to note that the market trends remain quite strong. Despite plenty of short-term breakdowns in key stocks this week, our Market Trend Model remains bullish on all time frames. This tells me to consider this market “innocent until proven guilty” but to always be looking for signs of a potential market reversal.
A quick review of key market breadth indicators this week shows that we are indeed seeing some of the warning signs often associated with major market tops. Does that mean the top is in, and that we’ll observe a major selloff in November? Not necessarily. But it does tell me to remain vigilant and observant for signs of distribution.
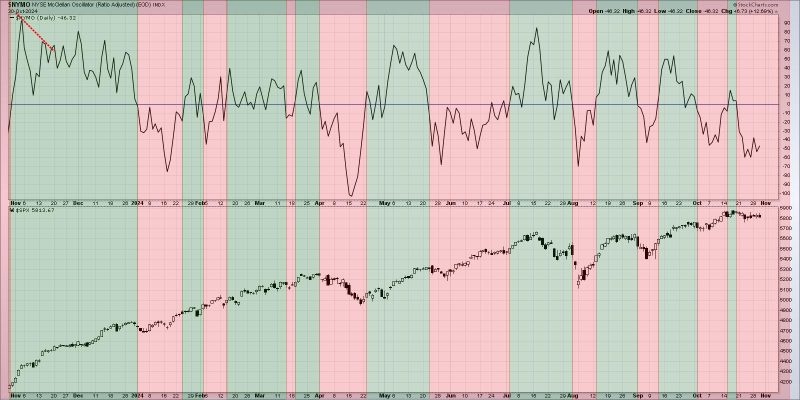
Negative McClellan Oscillator Suggests Short-Term Weakness
Let’s start with a short-term measure of market breadth, the McClellan Oscillator. Think of this indicator as a sort of a momentum reading for breadth conditions. And while other charts we’ll review address more of a long-term reversal in breadth, this indicator in particular is helpful for identifying short-term distribution patterns.
While the McClellan Oscillator did turn briefly positive a couple weeks ago, the indicator has spent most of the month of October in a bearish range. So, even though the S&P 500 and Nasdaq have made higher highs in recent weeks, this tells us that the pace of the advance is slowing, at least as measured by market breadth.

Have you taken our FREE behavioral investing course? During volatile market periods, all of your bad habits can become pretty expensive for your portfolio! Our free course is designed to challenge how you think about the markets, encourage you to upgrade your routines, and empower you to make better investment decisions. Check out our free behavioral investing course today!
Another way to think about this negative reading is that some of the smaller and more speculative stocks on the NYSE have already broken down, but the largest names with the biggest weights in the indexes remain strong. And if you look at previous bull market cycles, this is often how those long-term uptrends end.
Many S&P 500 Members Have Already Broken Down
I often use the 50- and 200-day moving averages to measure short-term and long-term trend conditions for individual stocks. Next we’ll look at the percent of stocks trading above their 50-day moving average, showing how many of the S&P 500 members remain above their 50-day moving average.
At the end of September, the reading was around 85%. As of this week, the number is closer to 55%. That suggests that about 30% of the S&P 500 members were above their 50-day moving average about a month ago, but have since broken below this short-term trend gauge. So, even though the S&P 500 and Nasdaq remain above their own 50-day moving averages, plenty of individual stocks have already broken down.
Also notice the bearish divergence, with the S&P 500 making higher highs in October while the breadth indicator is making lower highs. This often occurs toward the end of a bull market phase, where the largest names are still driving higher but more speculative and risky stocks have already begun the process of downside rotation.
Bullish Percent Index Speaks Downside Risks
Finally, let’s check out the Bullish Percent Index, a breadth indicator derived from point & figure charts. We can see that over 80% of the S&P 500 members were in a bullish point & figure pattern in late September, but that number is now down to below 70%.
Look over the last two years when this indicator has dipped back below 70%, and you’ll see why the recent breakdown suggests a pullback phase may be imminent. The lone exception was in January 2024, when the S&P 500 continued to pound higher even though the breadth readings were weakening. This was the “golden age” of Magnificent 7 stocks in 2024, where the strength in the largest names was enough to overcome the breadth deterioration readings.
Could the market move higher through Q4 despite these concerning breadth signals? Possibly. But since major market tops usually feature breadth readings just like these, I’m pretty happy taking a more cautious approach to the equity markets as we move into November.
RR#6,
Dave
P.S. Ready to upgrade your investment process? Check out my free behavioral investing course!
David Keller, CMT
President and Chief Strategist
Sierra Alpha Research LLC
Disclaimer: This blog is for educational purposes only and should not be construed as financial advice. The ideas and strategies should never be used without first assessing your own personal and financial situation, or without consulting a financial professional.
The author does not have a position in mentioned securities at the time of publication. Any opinions expressed herein are solely those of the author and do not in any way represent the views or opinions of any other person or entity.


